Overview
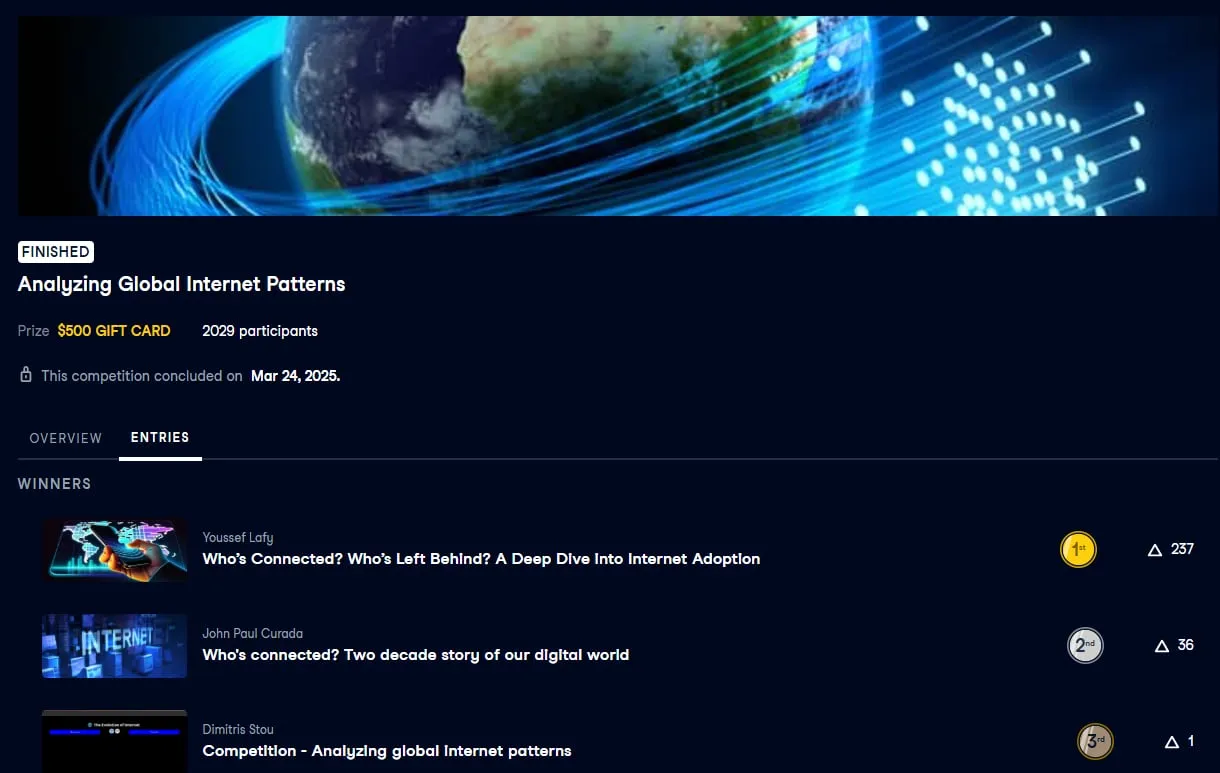
Took a dataset on global internet and digital connectivity, and turned it into a narrative spanning two decades. The interesting part wasn't just the numbers — it was the shape of the story: which regions leapfrogged, where growth stalled, and what the gap looks like today. Used Plotly for interactive charts and structured the piece around questions rather than just dashboards.
Gallery